Market Volatility Guide
Holding your nerve when markets are falling, whilst not easy, has proved to be ultimately rewarding, time after time.

Truly Independent Advice ● Whole of Market Access ● Tailored Solutions
During periods of heightened market volatility, when the value of your portfolio falls significantly from its original investment value or its previous highs, you may be tempted to think that an immediate change to the underlying investments is necessary in order to limit losses and protect the longer-term investment value.
This strategy, known as ‘tactical intervention’, is rarely ever successful, and on far too many occasions fails to deliver the expected results or to meet the longer term needs and objectives of investors.
Over the years there have been countless studies with regard to the long-term performance of tactical and strategic asset allocation investing, and their respective ability to deliver long term returns for investors. The results of this work show conclusively that tactical asset allocation models generally underperformed most benchmark indexes and they have tended to deliver lower long-term performances than strategic asset allocation models.
The truth is that no one knows with any certainty when markets will rise or fall, so choosing when to invest or disinvest is always clouded in significant uncertainty. Trying to time the markets correctly and consistently has proved to be a futile exercise for investors down the ages.
Research shows it is far better to use time to your advantage, as it is ‘time in the market’ (strategic approach) not ‘timing the market’ (tactical approach) that will more often deliver superior long-term results.
Making short term tactical changes to investment portfolios carries with it major challenges and pitfalls for investors, such as poor market timing, out of market risk due to the time it takes to disinvest from old funds and reinvest into new ones, increased transactional costs and potential asset sale taxation.
The strategic approach relies on picking the right funds and fund managers in the first place then blending them to create truly risk adjusted portfolios. Once the portfolios have been created it is a matter of sticking with those funds and fund managers through the ups and downs of the markets, only making strategic changes, if a fund or funds clearly breach defined quality and performance metrics that would render them no longer suitable for use.
The chart below illustrates what £1,000, invested from 1986 to 2021 would have been worth across three different UK indices, based on riding out all market downturns and staying invested the whole time (strategic allocation model) or withdrawing from the markets periodically and missing the 10, 20 or 30 best days over the last 35 years (tactical allocation model). The mistimed withdrawal and reinvestment decisions on an investment of just £1,000 could have cost almost £33,000 in returns.
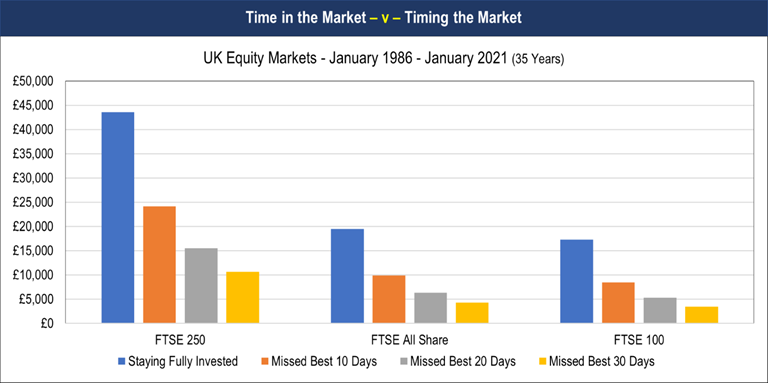
Source: Schroders. Refinitive data correct as at, 19th May 2021. Values shown for each index are total returns, which includes dividends and share prices, between 1st January 1986 and 1st January 2021. Figures have not been adjusted for the effect of charges and the rate of inflation. Note: Whilst the above chart just shows UK equity markets the same principle and subsequent returns holds true for all other global equity markets.
The Fall & Rise of Global Stock Markets
We all know that the world stock markets rise and fall on a daily basis in response to global issues of the time. We also know that in normal times this goes largely unnoticed by the investor public as the impact on their investments is more immediately self-correcting and subtle. However, when the markets suffer prolonged periods of downward movement which take a longer time to self-correct, some investors may have understandable concerns.
The important thing to remember here is that stock markets have to work, as they underpin all the world’s economies which in turn supports the world population in many ways. You may think this statement is obvious but consider this: if stock markets did not recover after a fall, it would not matter where you had put your money, it would all be practically worthless.
The markets will recover and push on to new heights, just like they have done in the past after all the biggest market crashes in history: The Great Depression in the 1920s, World War II 1939-45, Black Monday 1987, The Dot Com Bubble 1999/2000, Financial Crisis (Credit Crunch) 2008, Coronavirus Crash 2020, plus many other major but no less significant market falls. See bull and bear market history opposite.
In the investment world, the terms ‘Bull’ and ‘Bear’ are frequently used to refer to market conditions. These terms describe how stock markets are doing in general—that is, whether they are appreciating or depreciating in value. As an investor, the direction of the market is a major force that has a huge impact on investment portfolios. So, it's important to understand how each of these market conditions may impact your investments.
A ‘Bull’ market is a market that is on the rise with market sentiment and investor confidence generally high. The average Bull market duration over the last 90+ years has been 84 months, and the average Bull market return has been + 507%
A ‘Bear’ market is a market that is on the decline with market sentiment and investor confidence generally low. The average Bear market duration over the last 90+ years has been 20 months, and the average Bear market return has been – 36.5%
"I will tell you how to become rich. Be fearful when others are greedy. Be greedy when others are fearful."
Warren Buffet Billionaire
“I make no attempt to forecast the market—my efforts are devoted to finding undervalued securities.”
Warren Buffet Billionaire
"Experience has taught us that successful investing requires patience, discipline and the ability to control one’s emotions"
Graham, Munger, Buffett, Lynch, Bogle Famous Investors
To get the most from your savings and investments, take advice, invest for the long term, diversify your portfolio and hold your nerve through the ups and downs of global markets. It works time after time.
Bull & Bear Market History
|
Get in Touch - 0191 461 9400
Independent Financial Advice, Tailored - Clear - Effective